The rise of Open Access publications during the Covid-19 pandemic - a living article and dashboard
Tracking Open Access in times of COVID-19
Here, we measure in near time the number of publications on COVID-19 and Sars-CoV-2 and the share of Open Access publications. We generally focus on those Open Access publications that can be found in peer-reviewed journals, so-called golden Open Access, and those that can be found in repositories (green Open Access). To this end, we use Scopus, an important citation databases for peer-reviewed journals, The Lens, a “free & open patent and scholarly search” platform and bioRxiv, an important preprint server for the life sciences, as well as medRxiv for health science as sources for our dashboard. Of course, the data sources do not cover all relevant publications on Covid-19, however, they do cover a significant part and thus give an impression of how the balance between closed and open and gold and green is shifting as the crisis unfolds.
What does this tracking offer and why is it important?
The COVID-19 crisis is without doubt a special situation for research in general – and science in particular. Results on the virus need to be available quickly (speed) and are ideally accessible for the research community (in other words, “open”). Not only to enable academic collaboration around the globe, but also to form a basis for informed political decision making. On our dashboard (see below), the speed dimension of publishing is demonstrated by the amount of preprint publications, which are usually not peer-reviewed and therefore available faster. Openness is shown by the general number of open access publications.
What we are wondering is how the current crisis and the urge for scientific results will impact scholarly publishing in the long term. Will Open Access be standard after the crisis? What does it mean in terms of quality assurance, if in future more results are published without the established peer review process? Or rather, how can new quality assurance measures be implemented?
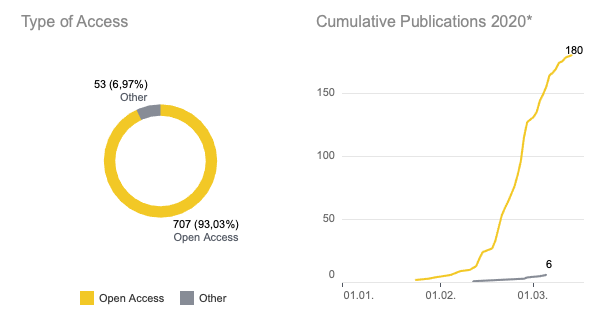
What the preliminary results tell us is that in the case of COVID-19 there is a shift in the weighting from closed to open access and that green open access has gained in importance. According to the European Open Science monitor, the majority of articles from 2018 (64%) were published in closed access. This picture is reversed when it comes to COVID-19 and raises the question if not all publications on grand challenges should be open access. It also shows that scholarly publishing can work without traditional publishers in the loop. However, it needs new models for quality assurance of preprints (e.g., overlay journals).
Join the discussion
As you know, at Elephant in the Lab we are great supporters of Open Access. We think that it is necessary to look into how Open Access can be sustainably anchored in the scientific system after the crisis. Because if COVID-19 shows us one thing, it is that knowledge has to be openly accessible. We welcome your feedback on our ongoing study and, of course, contributions that focus on sustainable Open Access.

Please note: This is a living blog post – we will update it regularly. You will not find a DOI for this blog post. The data has to updated manually. You can find the dashboard on Tableau Public. Please leave us a comment if you are interested in further analyses.
Method
- Our main source is Scopus, as it is one of the most important databases for academic research. Here we used the following search term:
TITLE-ABS-KEY ( “Wuhan coronavirus” ) OR TITLE-ABS-KEY ( “Wuhan-Hu1” ) OR TITLE-ABS-KEY ( “2019-nCoV” ) OR TITLE-ABS-KEY ( “COVID-19” ) OR TITLE-ABS-KEY ( “Sars-cov-2” ) - As we wanted to visualise a change over time of Open Access articles and the Scopus output has no date given, we added information from the COVID-18 Scholarly Works Collection at The Lens.
- Next, we added preprints from the COVID-19 SARS-CoV-2 collection at bioRxiv.org.
- To get the most out of the data, we joined the datasets by DOI, but kept those that were not matching.
We connected the data sources using the tool Tableau Prep. We joined the data sources (see below) and deleted unnecessary columns for our research question:
