
How many authors does it really need to write a paper?
Motivation
As the major currency in the scientific reputation economy, the analysis of article publishing reveals different disciplinary cultures and working styles. In STEM fields (science, technology, engineering, and mathematics) scientists publish several short articles per year in collaboration with many colleagues around the world, while in the humanities an author might work alone or in a group of two, writing a book or a longer article.
In an attempt to understand scientific working styles better, we took a closer look on the number of authors per article in various disciplines (Table 1). We focused on the 20 highest performing authors in every subject area according to Scopus (see Schmidt et al. 2017a for the detailed methodology).
Summary of the results
In a series of short analyses, we analyzed coauthorship in 27 subdisciplines according to Scopus. For the most disciplines we analysed, the number of authors per article is increasing over time (2010 to 2016), although slightly. However, one subdiscipline – Physics and Astronomy – is outstanding. With a mean of 1,268 authors per paper and a maximum of 5,154 authors of one article (Schmidt et al. 2017b, original article, see also Table 1) this discipline features by far the most authors. The high number of authors is not a unique case in one paper (Figure 1) and the number of coauthors is still increasing by 58 per year (Table 1). In 2016, over 50% of the articles in Physics and Astronomy have more than 1,000 authors.
The average number of authors per article is much higher in Physics and Astronomy, but the maximum number of authors per articles in Medicine as well as Biochemistry, Genetics, and Molecular Biology is also above 1,000 (Table 1).
Meaning of Authorship – Good practice
We were wondering: What does authorship really mean if you share it with 1,200 other coauthors? Does it still reflect the complexity of scientific work and practice? Especially, if you consider that there are guidelines like the Vancouver Recommendations with the following four criteria on who is an author in medical journals:
1.) Substantial contributions to the conception or design of the work; or the acquisition, analysis, or interpretation of data for the work; AND
2.) Drafting the work or revising it critically for important intellectual content; AND
3.) Final approval of the version to be published; AND
4.) Agreement to be accountable for all aspects of the work in ensuring that questions related to the accuracy or integrity of any part of the work are appropriately investigated and resolved.
This is in line with the Australian Code for the Responsible Conduct of Research. In addition, in their Code, the authors clearly state:
The right to authorship is not tied to position or profession and does not depend on whether the contribution was paid for or voluntary. It is not enough to have provided materials or routine technical support, or to have made the measurements on which the publication is based. Substantial intellectual involvement is required.
Did all the authors in articles with several thousand authors contribute to the published work according to these guidelines? Of course not. If one divides the written words without acknowledgements and affiliations by the number of authors (ca. 1.1 words per author in the paper with 5,154 authors) it is questionable what a “substantial contributions” is. Authorship is merely a remnant from an analogue past and cannot depict the complexity of scientific collaboration today, at least in hyper-authored papers.
Factory science
Drawing from the sheer number of authors in Physics and Astronomy it can be supposed that scientific knowledge production is similar to the production in a factory. The actual work leading to a paper such as described is divided in so many small parts, that we can speak of a new form of division of labour in some disciplines of science – like in a factory where a lot of workers (researchers) contribute to a complex product (publication). In humanities disciplines one can speak of handicraftsmen, who do most of the steps leading to a final product on their own or with very few colleagues. Maybe also the understanding and meaning of the products may vary between these poles of scientific working models. While in one the article itself is actually the product, it is in some STEM disciplines just the (scientific) currency or sales channels.
The quantity of published articles (products) in the factory science subject area Medicine is outstanding: globally 20 authors coauthored 7,741 articles in seven years. The number of articles by the ‘best performing’ scientists are shown in Figure 2. With 651 articles in seven years and if we assume 250 working days per year, the uppermost author coauthored a paper every 3 working days. This is even outperformed in the subject area Physics and Astronomy with 993 articles coauthored by one author in seven years which means one article in less than 2 working days (Figure 3).
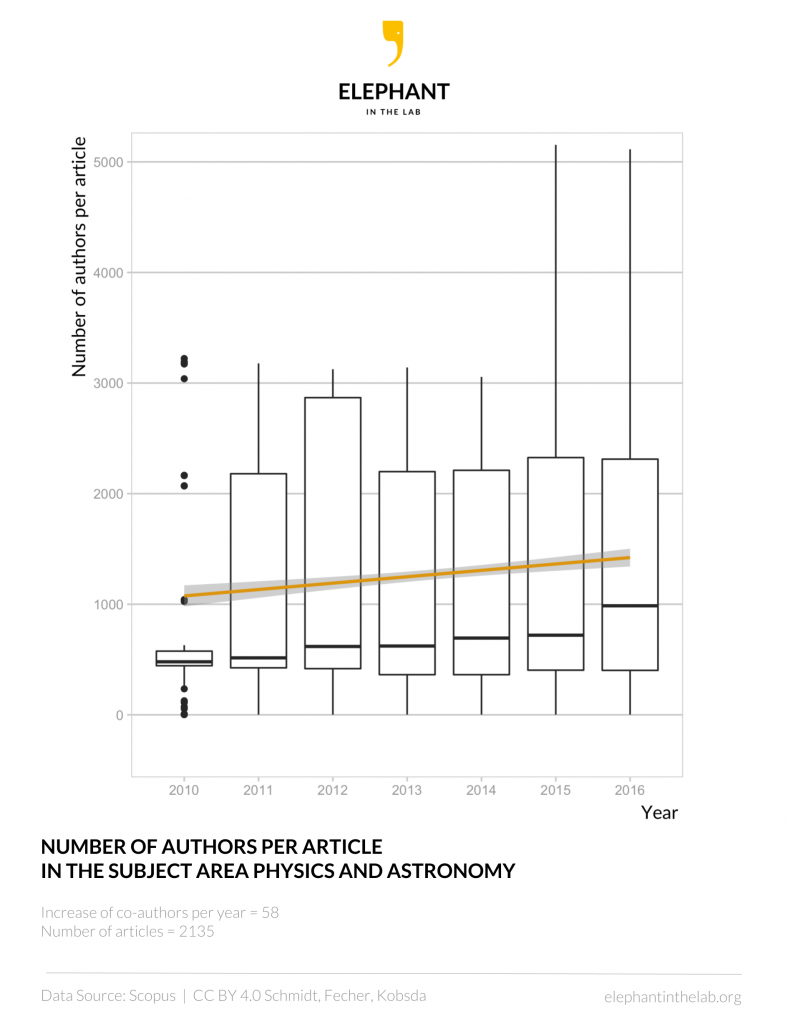
Figure 1: Boxplot of the number of authors per paper in the subject area Physics and Astronomy for the years 2010 to 2016 . The box denotes 25–75% of the values with the median (bold line) in it. The small circles are outliers. The yellow line shows a linear model of the mean number of authors per article with a confidence interval of 0.95 shown in light grey. Data source: Scopus. CC BY 4.0 Schmidt, Fecher, Kobsda.
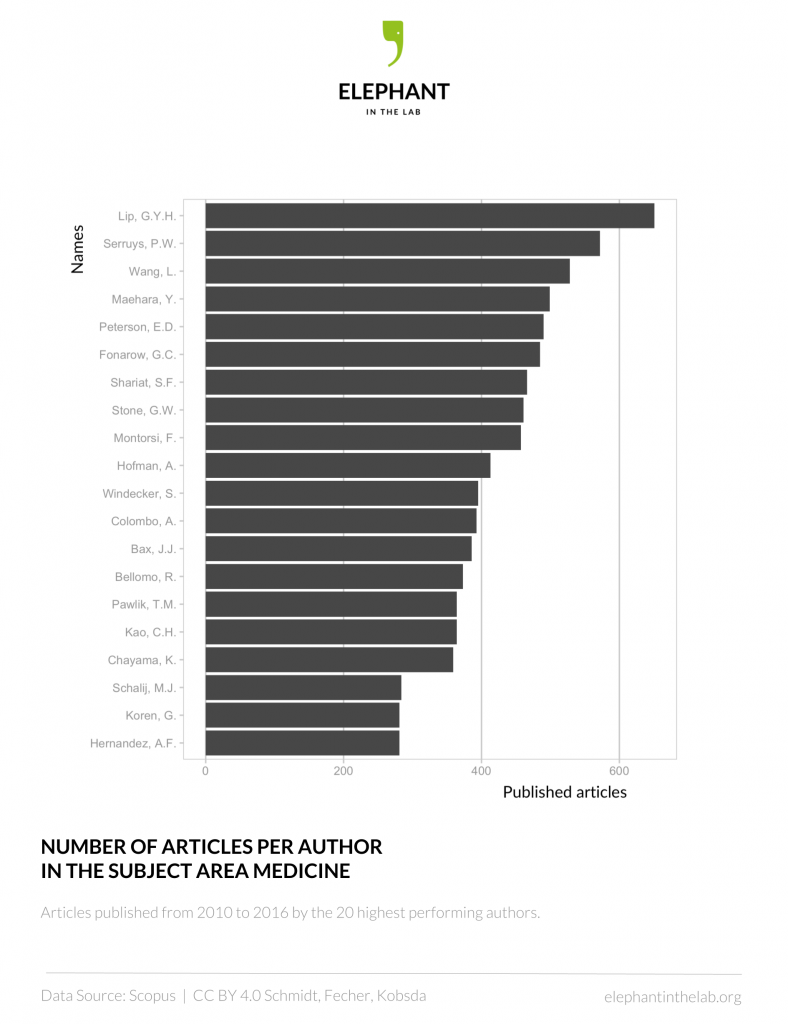
Figure 2: Number of articles per author for the 20 highest performing authors in the subject area Medicine for the years 2010 to 2016. Data source: Scopus. CC BY 4.0 Schmidt, Fecher, Kobsda.
As our first search was restricted (see Schmidt et al. 2017a for the detailed methodology), we took a second look on the top 20: on average, the authors listed in Figure 2 (co)authored 1,287 documents (within Scopus) in their ongoing careers with a mean of 46,612 citations per author. Unfortunately, two authors were not in the analysis of citations as the numbers were too big to display according to Scopus, likely because these numbers where >100,000. In Physics and Astronomy they (Figure 3) published 1,176 documents on average with a mean of 36,054 citations (again, excluding one author for the same reason).
A last, small and very simplified calculation and then we are done: if you divide the mean number of documents by the mean duration of the ongoing science foremen careers you get 59.5 articles per year in Physics and Astronomy and 43.5 in Medicine. And now, go back to work, lazybones.
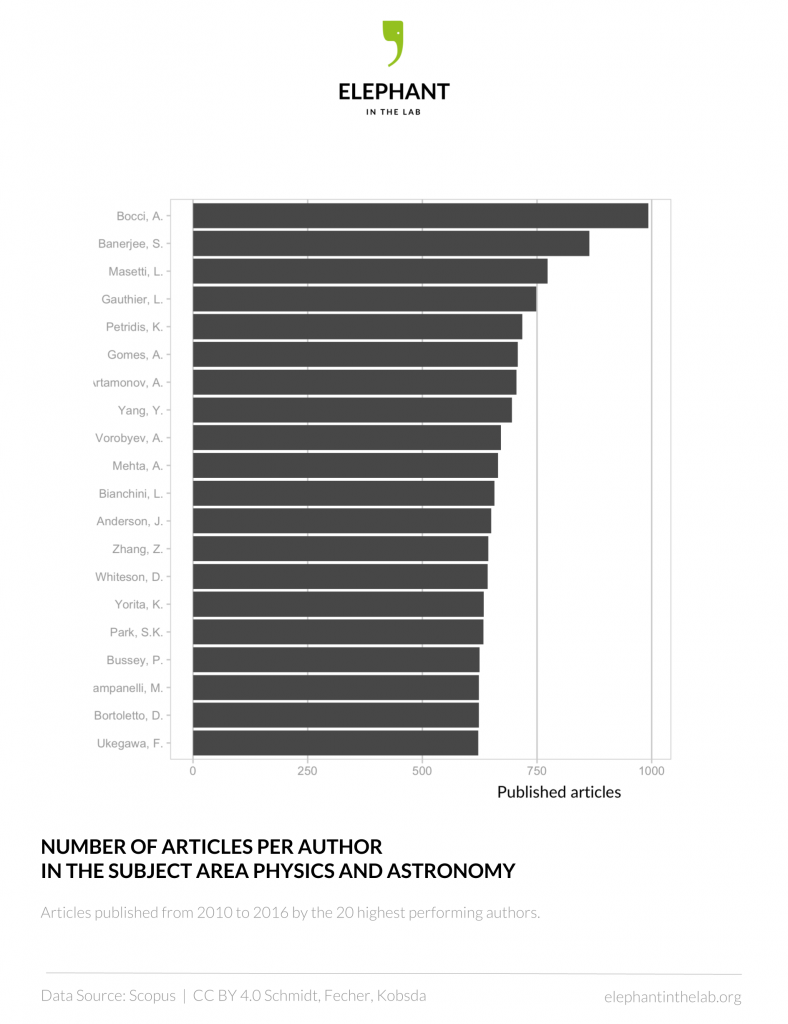
Figure 3: Number of articles per author for the 20 highest performing authors in the subject area Physics and Astronomy for the years 2010 to 2016. Data source: Scopus. CC BY 4.0 Schmidt, Fecher, Kobsda.
Table 1: Summary of bibliometrics for the 20 highest performing authors in the years 2010 to 2016 for each of 27 subject areas according to Scopus.
| Subject Area | Increase in number of coauthors per year | Mean coauthors per article | Maximal coauthors per article | Mean number of citations per article | Maximal number of citations per article | n |
| Agricultural and Biological Sciences | 0.2 | 5.2 | 111 | 8.9 | 479 | 2710 |
| Arts and Humanities | 0.0 | 2.1 | 8 | 6.6 | 40 | 749 |
| Biochemistry, Genetics, and Molecular Biology | -2.1 | 16.7 | 1269 | 33.4 | 1774 | 818 |
| Business, Management, and Accounting | 0.1 | 2.6 | 8 | 10.5 | 138 | 999 |
| Chemical Engineering | 0.3 | 2.6 | 15 | 5.9 | 112 | 1303 |
| Chemistry | 0.1 | 5.5 | 16 | 13.0 | 562 | 3142 |
| Computer Science | 0.1 | 4.0 | 21 | 11.4 | 199 | 1558 |
| Decision Sciences | 0.0 | 3.1 | 13 | 7.1 | 35 | 192 |
| Dentistry | 0.0 | 5.5 | 25 | 13.6 | 183 | 1536 |
| Earth and Planetary Sciences | 0.3 | 8.7 | 468 | 23.4 | 1375 | 2818 |
| Economics, Econometrics, and Finance | 0.1 | 2.8 | 9 | 8.4 | 188 | 1077 |
| Energy | 0.3 | 3.6 | 11 | 19.7 | 496 | 1683 |
| Engineering | 0.3 | 2.8 | 34 | 9.8 | 480 | 3828 |
| Environmental Sciences | 0.1 | 5.9 | 49 | 17.5 | 624 | 1759 |
| Health Professions | 0.1 | 3.7 | 16 | 7.0 | 140 | 808 |
| Immunology and Microbiology | 0.4 | 9.7 | 83 | 34.4 | 2938 | 968 |
| Materials Science | 0.2 | 4.1 | 13 | 15.1 | 490 | 1318 |
| Mathematics | 0.1 | 2.9 | 9 | 8.2 | 357 | 3657 |
| Medicine | 0.4 | 11.0 | 1193 | 30.7 | 2861 | 7741 |
| Multidisciplinary | -0.1 | 3.3 | 58 | 14.5 | 348 | 1111 |
| Neuroscience | 0.5 | 8.0 | 342 | 38.8 | 924 | 1122 |
| Nursing | 0.3 | 3.7 | 61 | 7.5 | 126 | 1282 |
| Pharmacology, Toxicology, and Pharmaceutics | 0.1 | 5.5 | 47 | 16.8 | 526 | 1165 |
| Physics and Astronomy | 57.8 | 1268.2 | 5154 | 27.4 | 3323 | 2135 |
| Psychology | 0.0 | 4.1 | 61 | 14.4 | 300 | 954 |
| Social Sciences | 0.1 | 2.7 | 14 | 9.7 | 485 | 1050 |
| Veterinary Science | 0.2 | 6.0 | 22 | 6.6 | 98 | 1404 |
Did any of the authors of this blog article, by chance, have a closer look at the 5000+ author paper and spent some thoughts about what “ATLAS Collaboration” and “CMS Collaboration” actually mean? I shared the building with some of these fellows during my PhD time and I learned that ATLAS and CMS are huge experiments involving a lot of work and they produce vast amounts of data that need to be carefully evaluated. There is a highly sophisticated system to distributedly carry out this evaluation, and I was taught that each person who significantly contributed to the results of a paper should be mentioned. In this particular case, the pulication is about the mass of the Higgs boson, a particle that came to some publicity because of its -uhm- relevance. Each one contributing to this breaktrough has deserved to be mentioned. (Without having checked this, I would assume that the other mentioned papers from “Physics and Astronomy” have a similar background. It is just a boatload of work.) Actually, you do not deny any of the things I said in your blog post. But, since you are not mentioning the special circumstances leading to these unusually high numbers, what is the point of this blog post?
Dear Christian,
thank you very much for your comment. As you have already solved most of the issues you raised yourself I want to answer your last questions: The point of this blog is to deal with elephants in the lab – those things which are not or not enough discussed in science. Maybe you are familiar with these high numbers of authors (and all your colleagues who already wrote us). But not all scientists do know. We want to show openly what authorship means in different scientific fields to discuss the value of authorship transparently. Contributing to an article in a way of preparing data means something different in other scientific fields. With our first analysis we made it possible to compare scientific fields.
In future, we will deal with more and different problems in science. I hope I could answer your question. Stay tuned!
Cheers
Martin (one of the authors)
Part of the misgivings that stand behind this blog, part of the elephant so to speak, not made explicit for whatever reasons, seems to me that with the shift in the concept of “authorship” reflected by publications with hundreds and thousands of authors the reader is at a loss with the question who are the authors of the article in a more conventional sense and that there is a legitimate interest in asking this question. To me (coming from the humanities, I must admit) the following would seem to be the obvious way out: (1) “Authors” of an article are indicated on the basis of something like the Vancouver recommendations, (2) all other collaborators are listed in a section “Collaborators” or “Contributors”, (3) preferably with an indication as to the nature and scope of their contribution, linked to a section or a footnote of the article. This, of course, would necessitate a revision of the metrics of assessing scientific achievement on the basis of “authorship” as is. And (3) would, I may surmise, make obvious the vanishingly small contributions of the big names to a host of publications published today under their name, which would make it hard to be implemented. (3) would, furthermore, in an article with thousands of “collaborators”, considerable augment the drafting effort, but in the same time make transparent the reason for which a person was mentioned formerly as an “author” and now is mentioned as a collaborator. Maybe simple figures reflecting authorships and citations could even be replaced (or at least supplemented ) by a “collaboration record” stringing together the collaboration credits in the articles by way of retrieval from a database. It seems evident to me that nude figures obtained by whatever metrics will not be helpful to scientific evolution in the long run.