Bibliometrics of the 20 highest performing authors in Energy, Engineering, and Materials Science.
Description
The number of authors per article in the subject area Energy is 3.6 on average with a maximum of 11 authors. The mean number of coauthors is increasing by 0.3 per year in the respective time period (Figure 1). The articles in this analysis (n = 1683) were cited 19.7 times on average with a maximum of 496 citations.
The number of authors per article in the subject area Engineering is 2.8 on average with a maximum of 34 authors (Figure 2). The mean number of coauthors is increasing by 0.3 per year in the respective time period. The articles in this analysis were cited 9.8 times on average and 480 as maximum. With a quantity of n = 3828 articles, Engineering has the second most articles in the respective time period (see Methodology) of all subject areas in Scopus.
The number of authors per article in the subject area Materials Science is 2.6 on average with a maximum of 8 authors. The mean number of coauthors is increasing by 0.1 per year in the respective time period (Figure 3). The articles in this analysis (n = 999) were cited 10.5 times on average with a maximum of 138 citations.
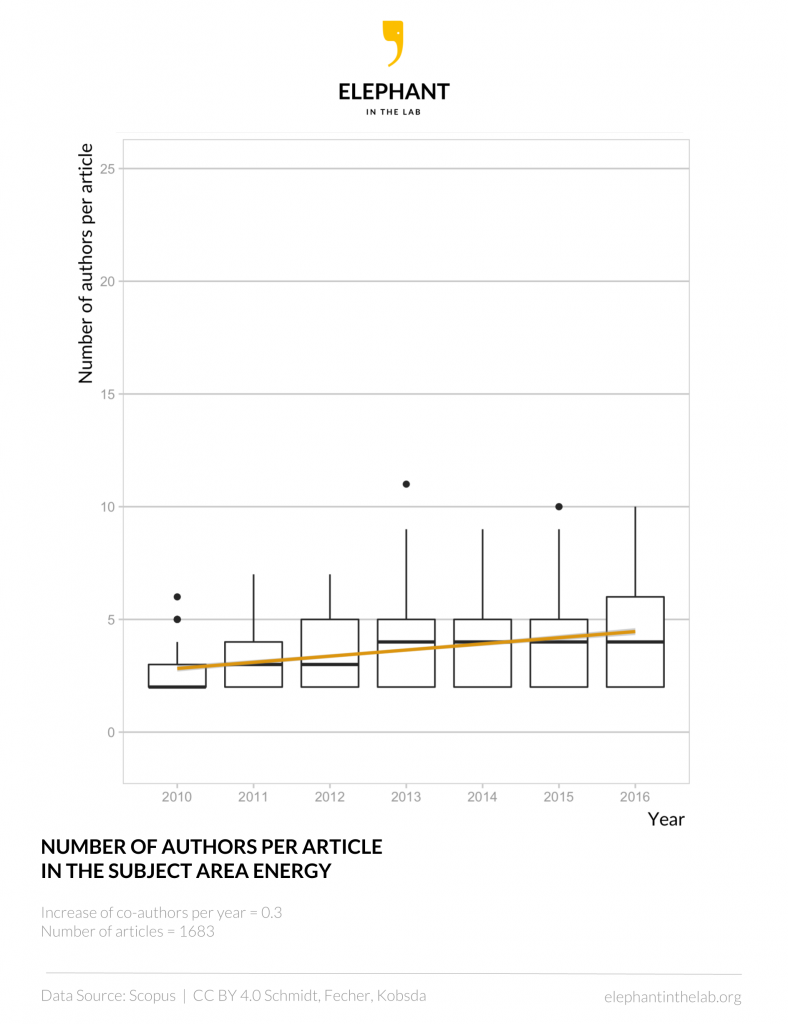
Figure 1: Boxplot of the number of authors per paper in the subject area Energy. The box denotes 25–75% of the values with the median (bold line) in it. The small circles are outliers. Due to a limitation of the y-axis, some outliers are not shown. The yellow line shows a linear model of the mean number of authors per article with a confidence interval of 0.95 shown in light grey. Data source: Scopus. CC BY 4.0 Schmidt, Fecher, Kobsda.
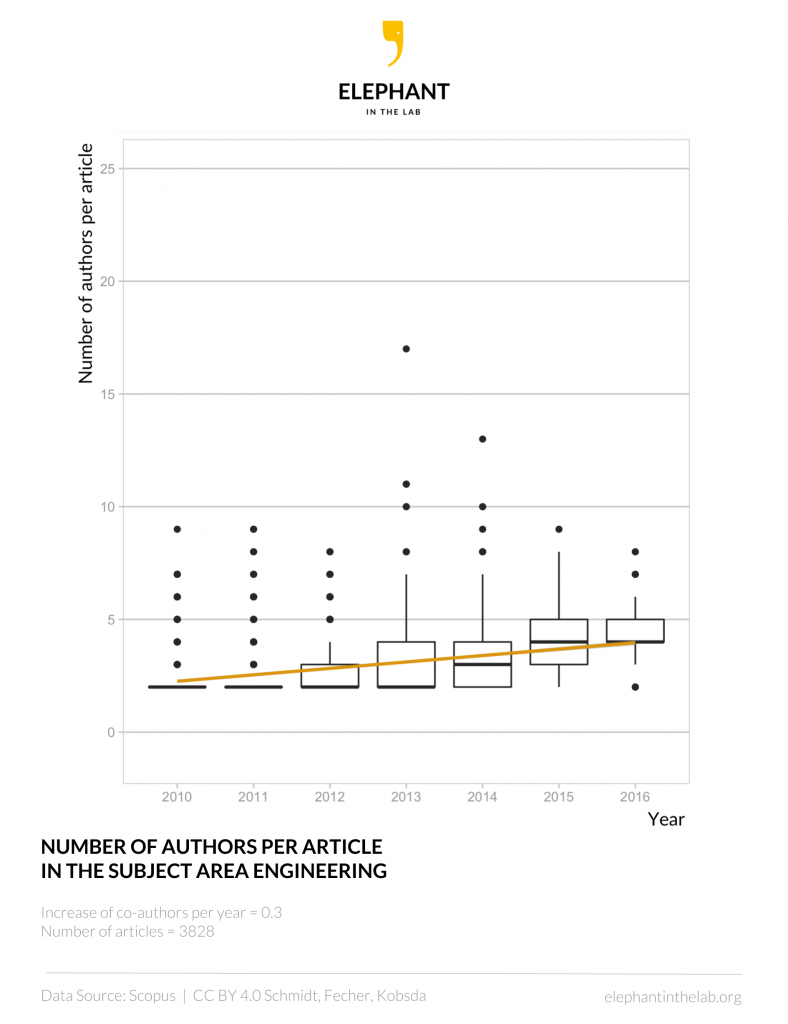
Figure 2: Boxplot of the number of authors per paper in the subject area Engineering. The box denotes 25–75% of the values with the median (bold line) in it. The small circles are outliers. Due to a limitation of the y-axis, some outliers are not shown. The yellow line shows a linear model of the mean number of authors per article with a confidence interval of 0.95 shown in light grey. Data source: Scopus. CC BY 4.0 Schmidt, Fecher, Kobsda.
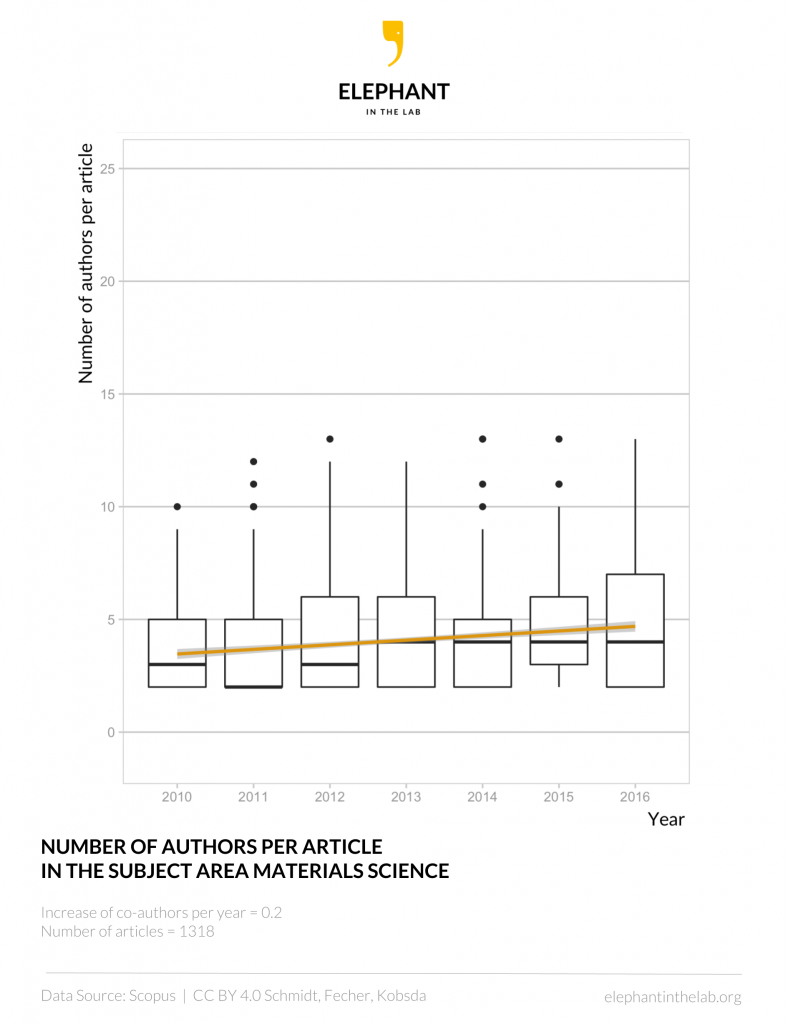
Figure 1: Boxplot of the number of authors per paper in the subject area Materials Science. The box denotes 25–75% of the values with the median (bold line) in it. The small circles are outliers. Due to a limitation of the y-axis, some outliers are not shown. The yellow line shows a linear model of the mean number of authors per article with a confidence interval of 0.95 shown in light grey. Data source: Scopus. CC BY 4.0 Schmidt, Fecher, Kobsda.
Methodology
The results of the Advanced search in Scopus were restricted by an algorithm with
- a time period of publishing (2010 to 2016)
- the document types (articles or reviews),
- and a quantitative limitation regarding the publication output (articles by the 20 highest performing authors with the most Scopus listed articles in every subject area).
For details and code see Schmidt et al. 2017.